RFSPACE NEWSBLOG

Using CODAR Signals for Ionospheric Sounding
CODAR is an example of an FMCW radar. (FMCW) is a radar system where a known stable frequency continuous wave radio energy is modulated by a triangular modulation signal so that it varies gradually and then mixes with the signal reflected from a target object with this transmit signal to produce a beat signal.
Most of the CODAR signals are around the US coast. These signals propagate well through the ionosphere and can be used to map the different layers of the ionosphere. The most common frequencies are:
4.513 MHz - 4.900 MHz
8.380 MHz - 8.390 MHz
12.020 MHz - 13.555 MHz
16.050 MHz - 16.315 MHz
24.100 MHz - 26.190 MHz
40.750 MHz - 44.210 MHz
All of the CODAR stations observed so far use down chirping. This means that the frequency moves down as time progresses. The slope of the chirp seems to vary depending on the geographical area and frequency. Most of the chirp rates in MHz/s appear to be odd multiples of 0.0036756 MHz/s . This is probably a rate based on the transmitter DDS frequency and number of points. Most of the chirps have repetition rates of 0.5 or 1.0 seconds and appear to be locked to GPS. There are a few “drifters” that do not appear to be locked.
The chirps are not continuous and appear to be gated to allow the transmission and reception at the same site. This gating adds AM sidebands to the chirp signal. These sidebands appear as lower amplitude signals to the left and right of the main pulse once the signal is de-chirped.
Empirical Data - Chirp Rates
25.600 MHz Approximate Chirp Rate = -0.2022 MHz/s
4.543 MHz Approximate Chirp Rate = -0.018378 MHz/s
4.660 MHz Approximate Chirp Rate = -0.018378 MHz/s
13.450 MHz Approximate Chirp Rate = -0.09926 MHz/s
4.526 MHz Approximate Chirp Rate = -0.025733 MHz/s
Once we know the chirp rates, it is possible to use a matched filter to de-chirp the signal. This processing has been built into the SpectraVue application. It is processed in the frequency domain by taking an FFT of the IQ received data and multiplying it by a copy of the transmitted pulse. Once the result is converted back to the time-domain, the range information can be extracted.
PI 2012
Friday, December 30, 2011
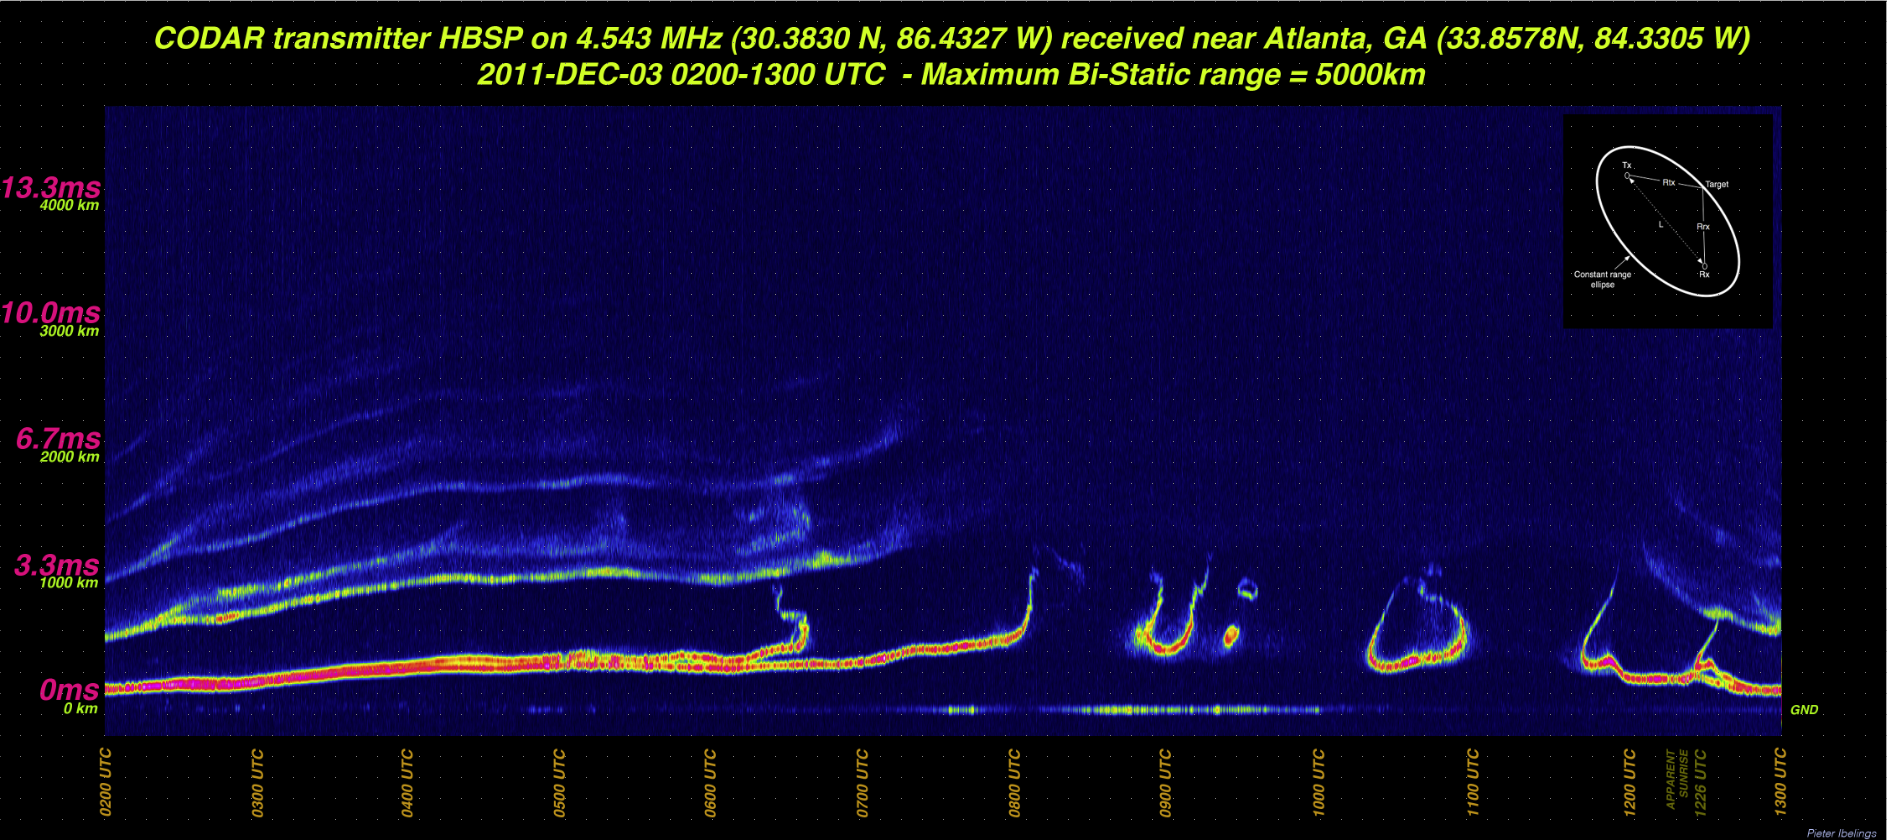
The image above is a gigapixel image of a CODAR radar on Florida received in Atlanta, GA. After de-chirping of the received signal, the range information is extracted. This image shows the different layers of the ionosphere at the received frequency over a period of several hours. The image links on the bottom of the image, will take you directly to the signal.